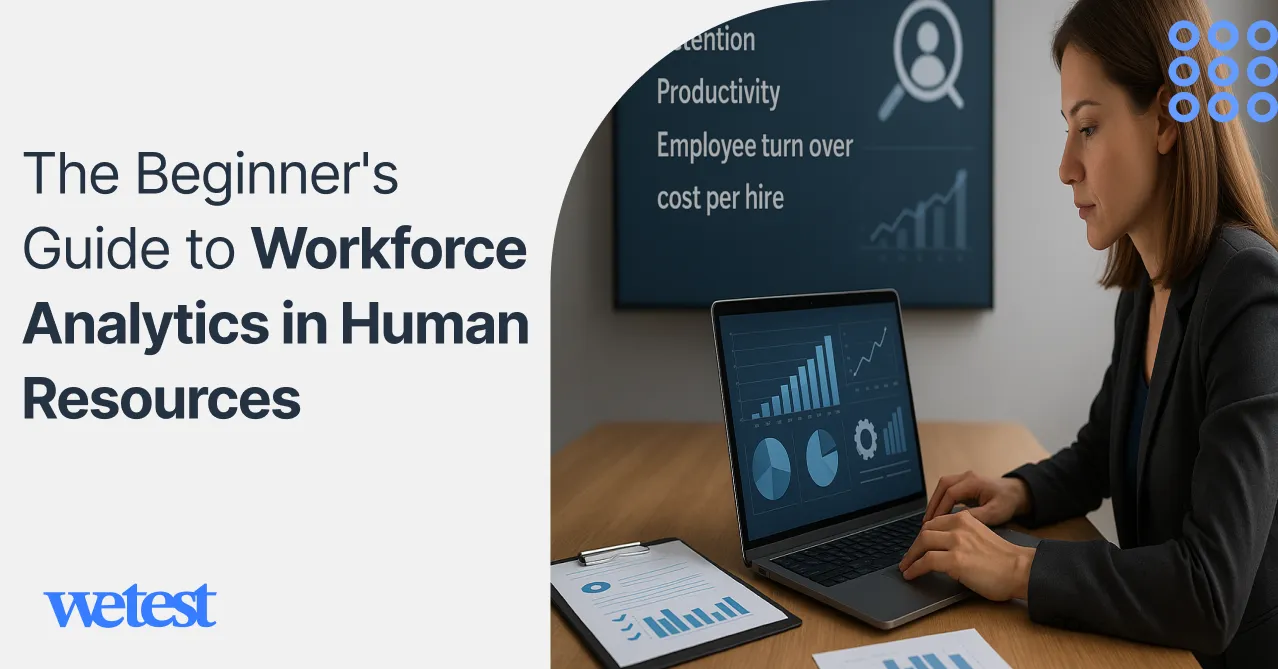
The Beginner’s Guide to Workforce Analytics in Human Resources
Human resourcesBonica
October 17, 2025
Workforce analytics is changing how companies make decisions about their employees. It’s all about using data to understand employees better and make smarter choices about hiring.
The numbers tell a big story. According to some Deloitte research from 2023, 76% of organizations are now prioritizing people analytics. That shows companies are moving away from gut-feeling decisions toward evidence-based HR management.
The benefits are real and you can measure them. Companies that use workforce analytics see a 25% drop in employee turnover and a 40% improvement in how well their hiring works. Those improvements directly impact the bottom line.
This guide is for HR pros, business leaders, and anyone new to analytics and wants to get this powerful tool.
Table of Contents
What is Workforce Analytics?
Workforce analytics is about collecting and looking at employee data so you can make smarter decisions for the business.
You’ll hear it called HR analytics, or talent analytics, but they all mean pretty much the same thing.
You start by creating reports and dashboards that show you the current situation. As you get better at it, you can push toward those predictive models that help you spot problems way before they hit.
Workforce analytics has to connect right into your entire business intelligence strategy. The whole point is to link your people data with the business results. This is how you finally figure out how the decisions HR makes are impacting how the company performs overall.
The data comes from everywhere, throughout the time an employee is with you. Recruitment systems track who you hire. Performance platforms measure how well they do. And learning systems show how they’re developing their skills.
Real-time analysis is getting popular now, which lets you watch a situation as it unfolds instead of waiting for those monthly reports. Companies that do this well can make decisions five times faster.
Workforce Analytics Metrics
To start understanding workforce analytics, you have to get a handle on the metrics that make your HR data useful. These metrics show you exactly how your people strategy is hitting the business results.
Every single metric links the daily stuff HR does to the bigger goals of the company, which gives leaders a clear view of how things are going with productivity and engagement.
The most important HR analytics metrics that should be tracked by every human resources team are listed below.
Employee Turnover Rate
The employee turnover rate is the fundamental thing in workforce analytics. All it does is tell you how often people are leaving the company over a certain period of time.
This one little KPI answers a hugely important question. How stable is your workforce?
High turnover rate is a giant red flag for problems with the managers and the culture. A low rate is a good sign that people are engaged and the company is healthy.
Where HR analytics gets awesome is when you break down that turnover by which department it’s happening in, how long people have been there, or their performance level.
You might find that voluntary turnover suddenly jumps right after the six-month mark, which is a huge hint that your onboarding process or how clear you make the job roles is the problem.
Fancy workforce planning software these days can even predict how many people will leave based on past trends, so HR can get ahead of the problem and make retention strategies stronger before it happens.
Employee Retention Rate
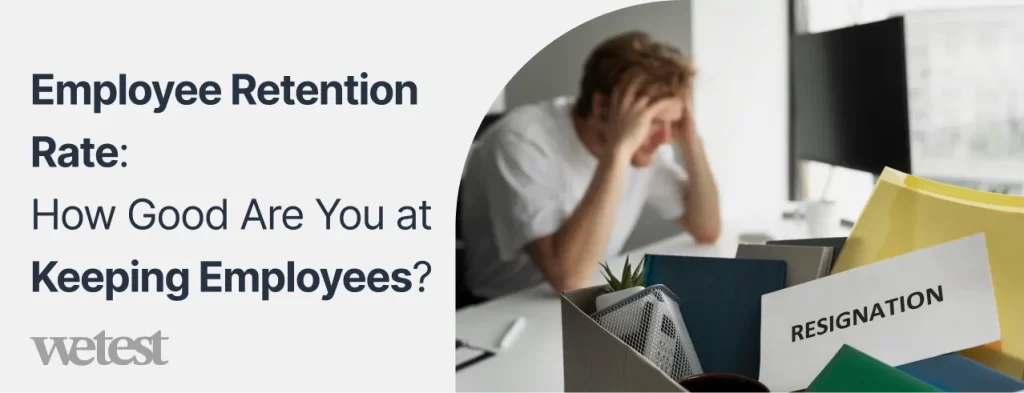
This rate is the other side of the coin from turnover. It measures how good you are at keeping people over a certain time.
This service-level indicator is a great way for HR teams to see if their engagement programs and career path opportunities are working. It points to competitive pay and solid leadership support.
Combine this retention data with engagement scores and performance reviews to predict who’s going to stick around.
Time to Hire
The Time to Hire metric is an important one in recruitment analytics because it tracks how many days go by from when a candidate first applies until they accept your job offer.
It shows you how efficient your talent acquisition process is, and it has a direct impact on how candidates feel about you and how fast your business can move.
If your time to hire is long, that’s a sign you’ve got some serious bottlenecks. Cutting that time down helps your organization snap up the best talent quickly.
HR bigwigs compare the Time to Hire with Time to Fill to get the full story on how efficient their recruiting is. The latter is the total time from when the job was requested until the person starts.
Your workforce analytics dashboards help the HR team figure out exactly which part of the hiring funnel needs to be fixed.
Cost per Hire
Every single HR department needs to know the exact dollar amount they are spending to get new talent in the door. The Cost per Hire is the metric that figures that out.
Recruiting costs cover things like advertising bills, fees for recruiters, background check expenses, any relocation costs, and the onboarding programs.
Now, having a high Cost per Hire isn’t automatically bad; it can be worth it if the quality of the person you hire and their retention once they are there are both strong.
In a mature workforce analytics setup, the Cost per Hire data helps HR leaders find the sweet spot between being efficient and actually being effective.
Quality of Hire
While time and money tell you how efficient the hiring process is, Quality of Hire is what measures the impact of those new people. It’s about figuring out the overall value they bring to the company.
Since quality is kind of a vague word, HR analytics teams create a blended score by combining performance ratings, retention rates, and how happy the hiring manager is.
You could have a quality of hire index that puts 40% of the weight on performance review scores, 30% on retention in that first year, and the last 30% on feedback from the hiring manager.
Tracking this metric consistently lets HR get better at things like where they find candidates, how they write job descriptions, and making the onboarding process better.
Absenteeism Rate
This is the metric that figures out the percentage of workdays your staff misses unexpectedly.
The number shows how your employees are doing and what your workplace culture is like.
If people are constantly missing work, that can be a big red flag for burnout or problems with management. If the number is low, you might have a problem with people not reporting absences or presenteeism.
Using your workforce analytics tools, HR can slice up that absenteeism data by which department, what role, or what time of year to spot patterns and go after the actual cause.
Productivity per Employee
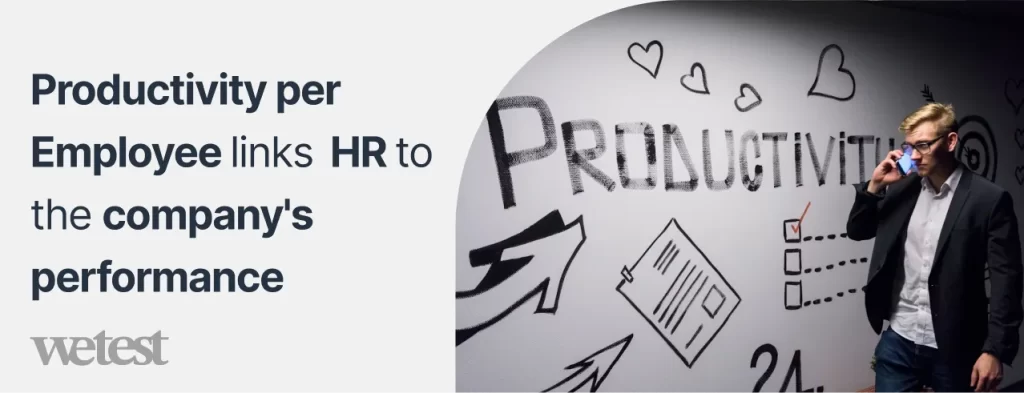
To link what HR is doing to the company’s performance, one of the most important things to look at is productivity per employee.
This metric is great for helping leaders check on how efficient their workforce is and figure out the right staffing levels.
If the revenue per employee starts going down, HR analytics can step in and help find the problem.
Training ROI
Spending money on employee learning is important, but you have to measure what that investment is doing.
This is the metric that determines exactly how much value the company gets from all its learning programs.
Keeping an eye on this metric inside your HR analytics dashboards lets the leaders see which programs are driving performance.
Those learning analytics can connect the training data right to engagement levels and who gets promoted.
Forecasting Accuracy
It basically measures how close your staffing predictions were to what happened, and you express it as a percentage or a margin of error.
This metric is key because it shows how good your HR team is at seeing future needs for staff and figuring out hiring needs. Being accurate with your forecasts helps you keep costs down and keep the business running smoothly.
The modern HR software helps companies make their forecasting models much better by using old data and seasonal patterns.
Step-by-Step Implementation
For workforce analytics to work, you need to use a structured approach. Just break the whole implementation into smaller phases. That’s the best way to cut down on the risk of failure.
Data Audit and Infrastructure Setup
First off, you need to look at all the places your data comes from. That means your main HR system, your applicant tracking system, the learning management system, and all your payroll platforms. You need to write down exactly what data each system has.
Then, you should check the quality of that data by looking for missing information and formats that aren’t consistent. You have to set up some clear rules for how you’re going to clean it up and keep that data good moving forward.
After that, you should create a master data management strategy so you end up with a reliable source of truth for all your employee information. And finally, you’ll need to figure out a plan for how you’re going to move all your old data.
Team Structure and Capability Building
You should make a choice. Do you want to centralize your analytics team, or do you spread that capability out across all the different parts of the HR department?
Both ways have their upsides. Centralized teams can get that deep expertise, but the downside is they might not be as quick to jump on the specific needs of a random department.
The key people you’ll definitely need are HR data scientists and business analysts. When you’re developing that team, don’t forget how important it is for them to understand HR.
You should build a skills roadmap that covers statistical analysis, knowing how to visualize data well.
You could even look at partnering with people outside. IBM analytics transformation included training over 10,000 employees in data skills, and that massive investment paid off huge with way better decisions being made.
Compliance Framework
You must set up clear policies for data privacy and security right away.
Make sure you’re following the rules and regulations. You also have to create clear ways for employees to give their consent for their data.
You should implement a process to spot any bias and regularly perform fairness audits.
Form an ethics committee to help guide your decisions when you run into sensitive issues.
Pilot Program Development
When you’re picking your first projects, you should choose based on the impact they’ll have on the business and also how easy they are to actually pull off.
Predicting turnover and figuring out how effective your recruiting is are great starting points because you can see a clear return on investment from them.
You should start by developing those projects and give them specific criteria for success. You need to get feedback from your stakeholders constantly and just keep making changes and improving based on everything you learn along the way.
KPI Development and Dashboard Creation
You need to make sure your metrics line up with your business goals, not just measure whatever is simple to track.
Set up some good benchmarks and create targets for improvement that are realistic. Also, you should build separate dashboards for the executives and for the people who are doing the operational work.
The executives only need to see the big trends, but the HR business partners need all the detailed data. Plus, you can set up automated reporting and alerts to guarantee that the right person gets the information exactly when they need it.
A Quora Rundown
Here is a summary of Quora users’ experiences with workforce analytics.
Learning and Career Paths
Many users emphasize that workforce analytics is as much about learning and continuous upskilling as it is about tools.
Riya Seth suggests structured programs and projects:
“Students will receive 10+ real-time projects and 2 capstone projects,” a point repeated by others who recommend hands-on coursework over purely theoretical classes.
Prachi notes that practical exposure and a strong fundamentals base are essential for a successful career: “To have a successful career in HR analytics you must understand its fundamentals.”
Myth-busting and Surprising Predictors
Several users highlight the detective work in people analytics, debunking assumptions and revealing odd but useful predictors.
Alex Hagan shares three case studies of myth-busting where analytics overturned beliefs:
“We were able to prove the null hypothesis… there was no statistical relationship between pay and performance.”
Alex also notes a quirky signal:
“If the candidate applied from a gmail address, they were more likely to be a successful permanent placement.”
Practical Use Cases and ROI Focus
Users advocate starting with ROI problems, such as hiring effectiveness and productivity.
Georgia Kelly frames workforce analytics as an ROI tool:
“It is the algorithm-linked model… to offer ROI evidence for employee-related choices.”
Beth De Lima stresses connecting HR actions to business outcomes:
“Establishing a relationship between what HR does and business outcomes … is what HR analytics is all about.”
Tools, Vendors, and House Innovation
Some users spotlight vendor solutions and internal platforms.
Ken points to HCL’s Nippon as an example of a powerful productivity analytics tool used at scale:
“Nippon… helped the company increase its revenue during the pandemic and maintain its competitive edge.”
Others note that HR datasets are much smaller than consumer big data, but still benefit from mature analytics techniques (Nita).
Engagement Drivers and Human Context
Some focus on interpreting engagement data to drive action. Nita explains how analytics can identify engagement drivers and measure the effect of interventions:
“Identify and Improve Engagement Drivers … These engagement drivers can then be improved and their impact measured.”
Prachi stresses reward programs as outcomes that analytics can validate. Use analytics to prioritize interventions and then measure lift, not just correlations.
Ethics, Bias, and Domain Knowledge
A warning is to pair technical skill with ethical guardrails and deep HR domain knowledge.
Alex Hagan calls out the need to question “sacred truths” and to manage change:
“Workforce Analytics is only partly about statistics… understanding your domain, being prepared to question ‘sacred truths’, influence, change management.”
Gundeshwari reminds us that analytics must link back to business performance, not just produce metrics. Involve HR and legal early, and treat analytics as a people-centric discipline.
Conclusion
Workforce analytics in human resources represents a strategic imperative for organizations seeking a competitive advantage. The shift from intuition-based to data-driven HR decisions is no longer optional.
Start with a solid foundation of clean data and clear objectives. Choose tools that match your current capabilities while providing room to grow. Build skills gradually and celebrate early wins to maintain momentum.
Technology will continue evolving, and your capabilities will grow over time. The key is starting now with pilot programs and scaling systematically.
The future belongs to organizations that can attract, develop, and retain talent more effectively than their competitors.
FAQs
What is the difference between workforce analytics and traditional HR reporting?
Workforce analytics explains and predicts outcomes using data science, while traditional HR reporting only summarizes past metrics.
How much should I budget for workforce analytics implementation?
Small pilots start at around $ 25,000–$ 100,000; expect $ 100,000–$ 500,000 for mid-size programs and $ 250,000+ for enterprise programs (including licenses, staff, and recurring costs).
What data sources do I need to get started effectively?
Begin with HRIS, ATS, payroll/time, performance, learning systems, and engagement surveys.
How do I address employee privacy concerns and maintain trust?
Be transparent, minimize and anonymize data, require consent, enforce access controls, and follow applicable privacy laws.
What skills should I prioritize when building an analytics team?
Combine HR domain experts, data engineers/analysts, and at least one data scientist, plus strong communication and governance skills.
How long does it take to see meaningful results from workforce analytics?
Descriptive dashboards can appear in 1–3 months; predictive ones typically take 6–12+ months.
Which workforce analytics use case should I implement first?
Start with turnover prediction or hiring effectiveness.
How do I ensure my workforce analytics models remain accurate over time?
Monitor model performance, track data drift, retrain regularly, version models, and incorporate user feedback loops.
Hire the best candidates
with Wetest.
Create pre-employment assessments in minutes to screen candidates, save time, and hire the best talent.
Try for free